Diary Studies Analysis
Last updated: August 21, 2026
Diary studies are built session by session — each session in your diary study is technically its own study, living inside one project. That structure matters for analysis: it determines what you can see per session versus what you can only see by pulling sessions together yourself. Here's how to navigate it, and what to know if you're expecting a built-in longitudinal view.
1. Know how your sessions map to analysis tools
Every session (Session 1, Session 2, etc.) is its own study, each with its own Insights page, Reports tab, and data. Your project — the diary study as a whole — is what ties them together, and it's also the level at which Chat With Your Data and Topline operate.
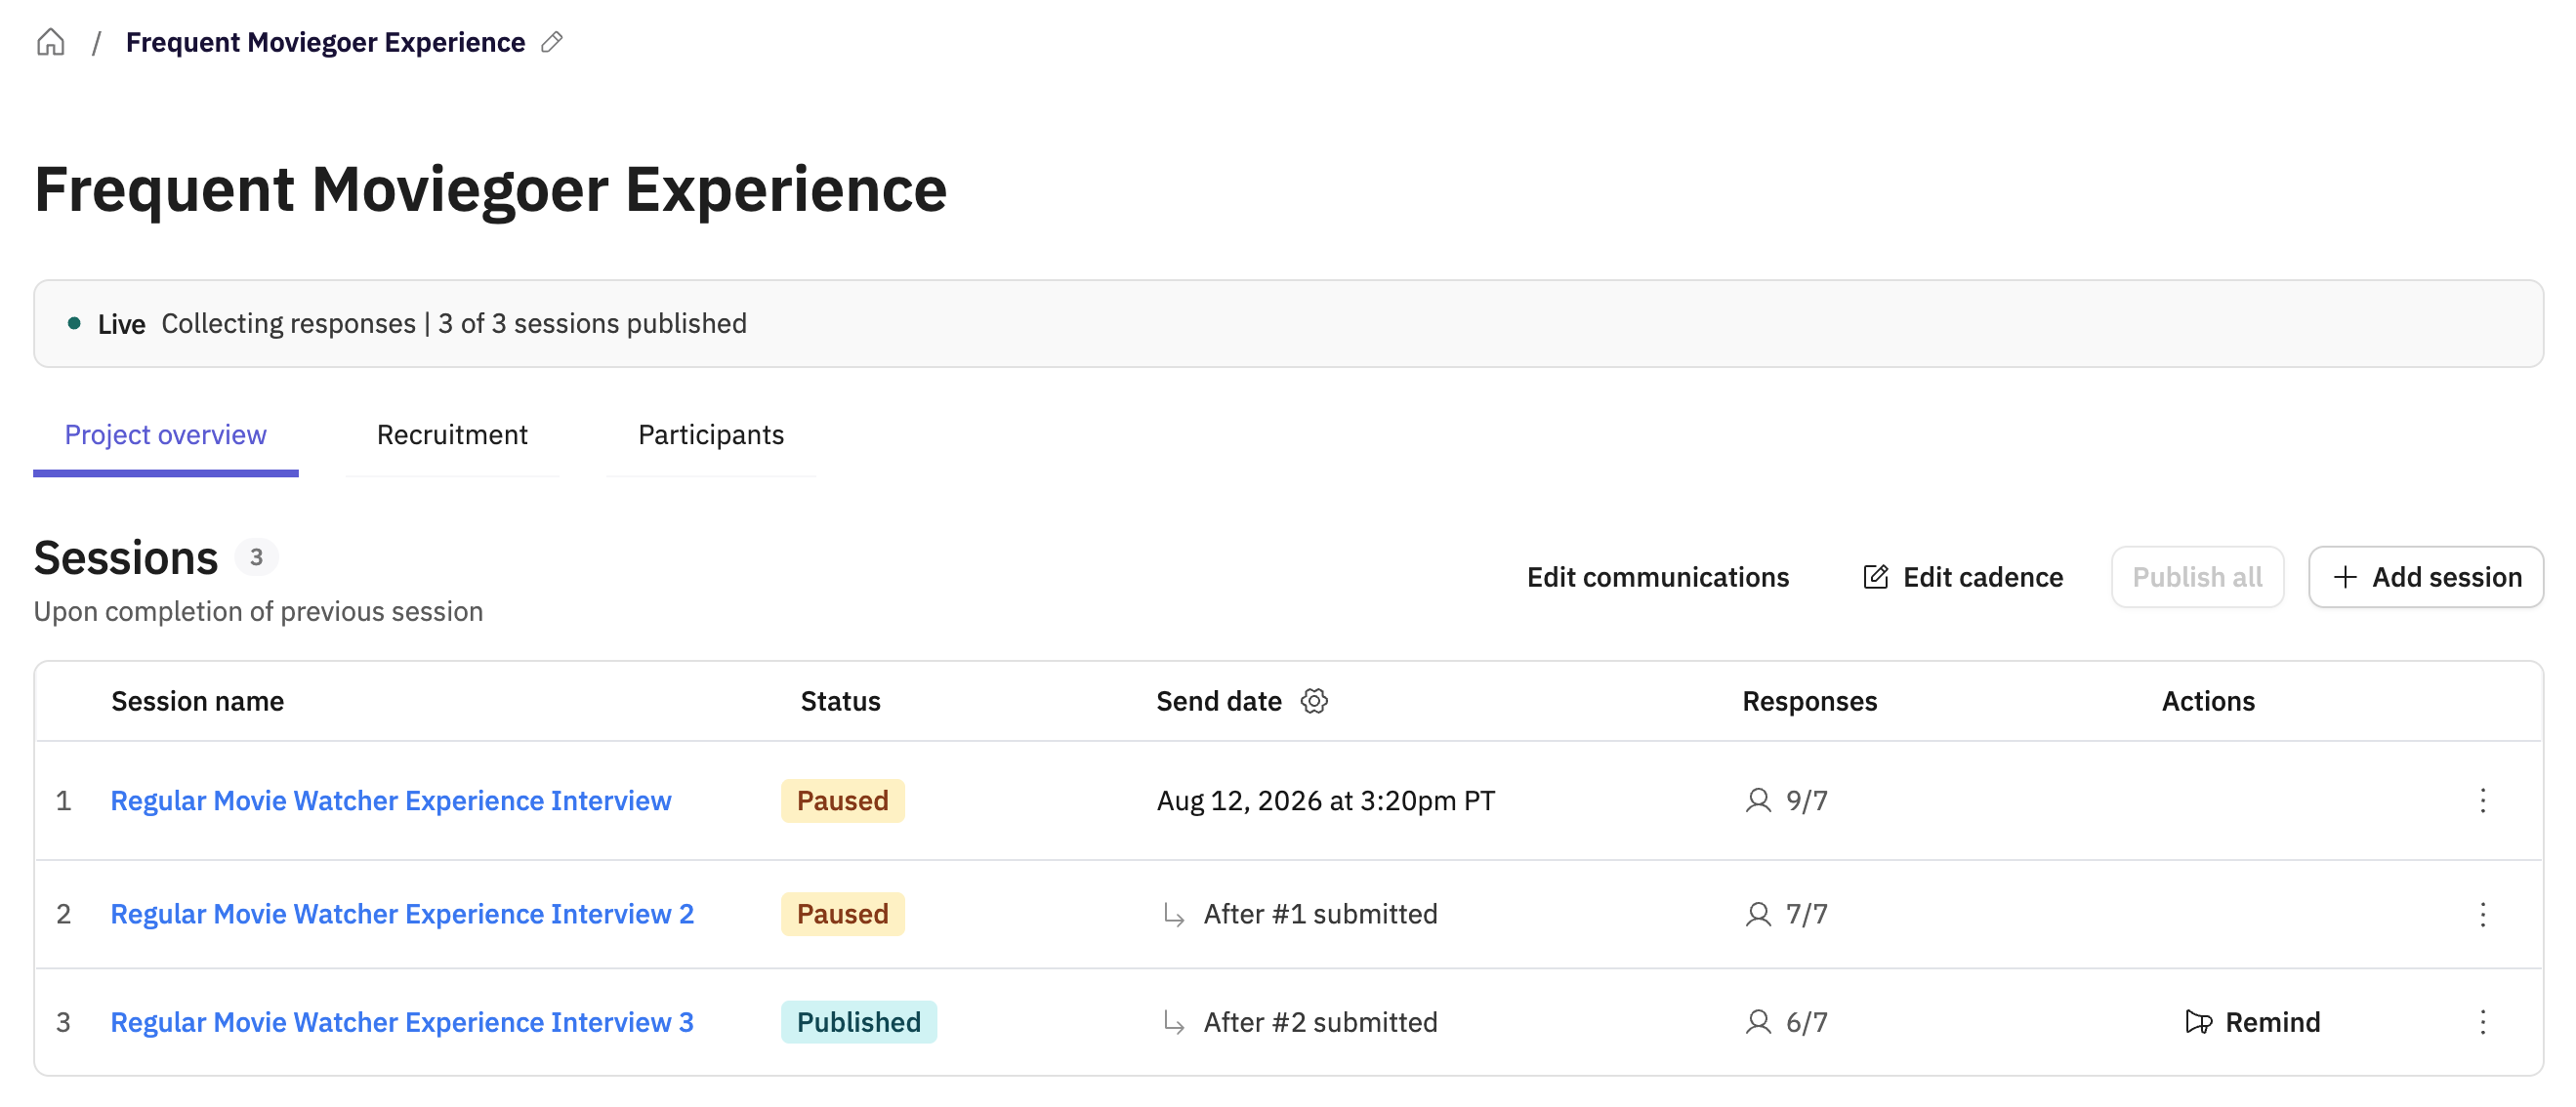
This is the most important thing to understand before you start analyzing: there's a difference between looking at one session's data and looking at your whole diary study's data, and Outset's tools allow you to do both.
2. Check the participant table for where people are in their journey
Before you get into content analysis, the project-level participant table gives you an operational view of where each participant stands: Invited, In progress, Completed, or Dropped, broken out per session.
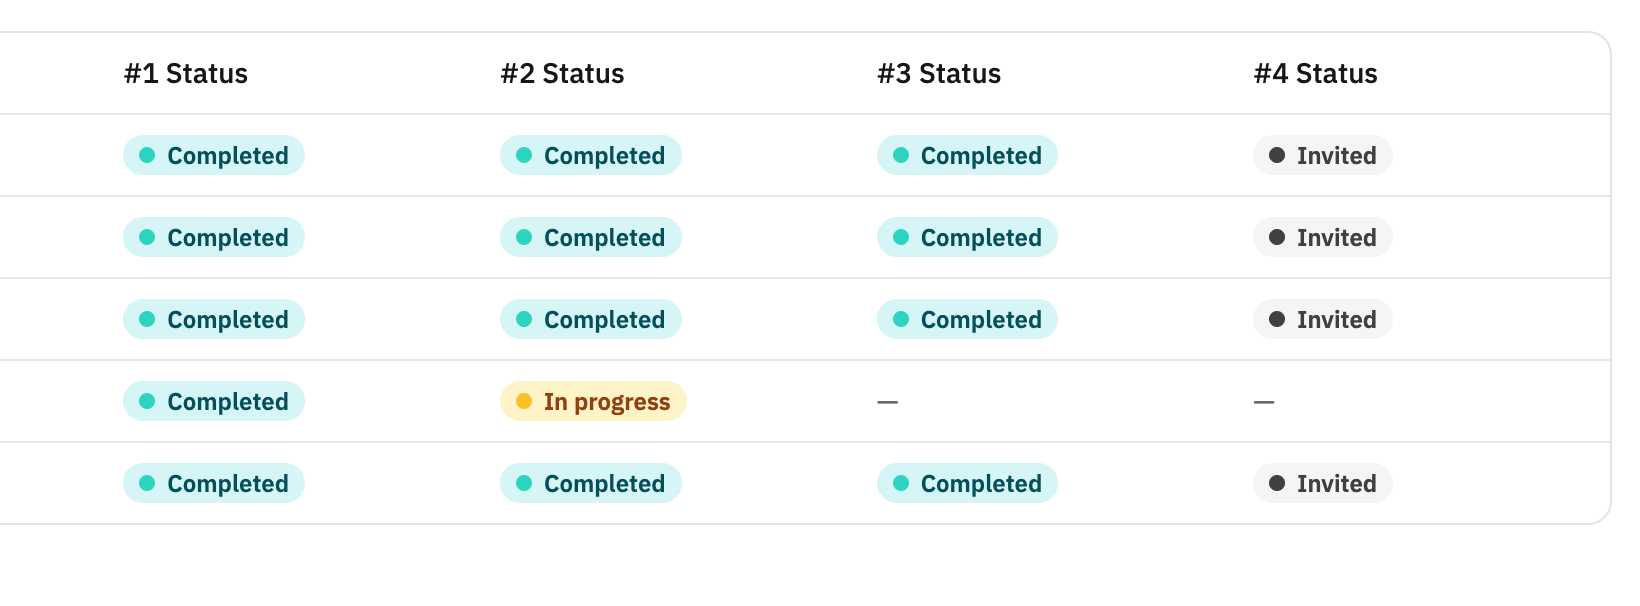
Please note: this table tells you where participants are in the process — it doesn't summarize what they said. For that, you'll want the tools below.
3. Start each session's analysis on its own Insights page
Since each session is its own study, you can select each study's Insights page once it has 5+ completed interviews for that session — with an Executive Summary (topics, # of completed interviews, average session time), a Highlights section surfacing overarching themes, and a Findings section organized by that session's guide questions, complete with charts, categorized responses, and clickable participant quotes.
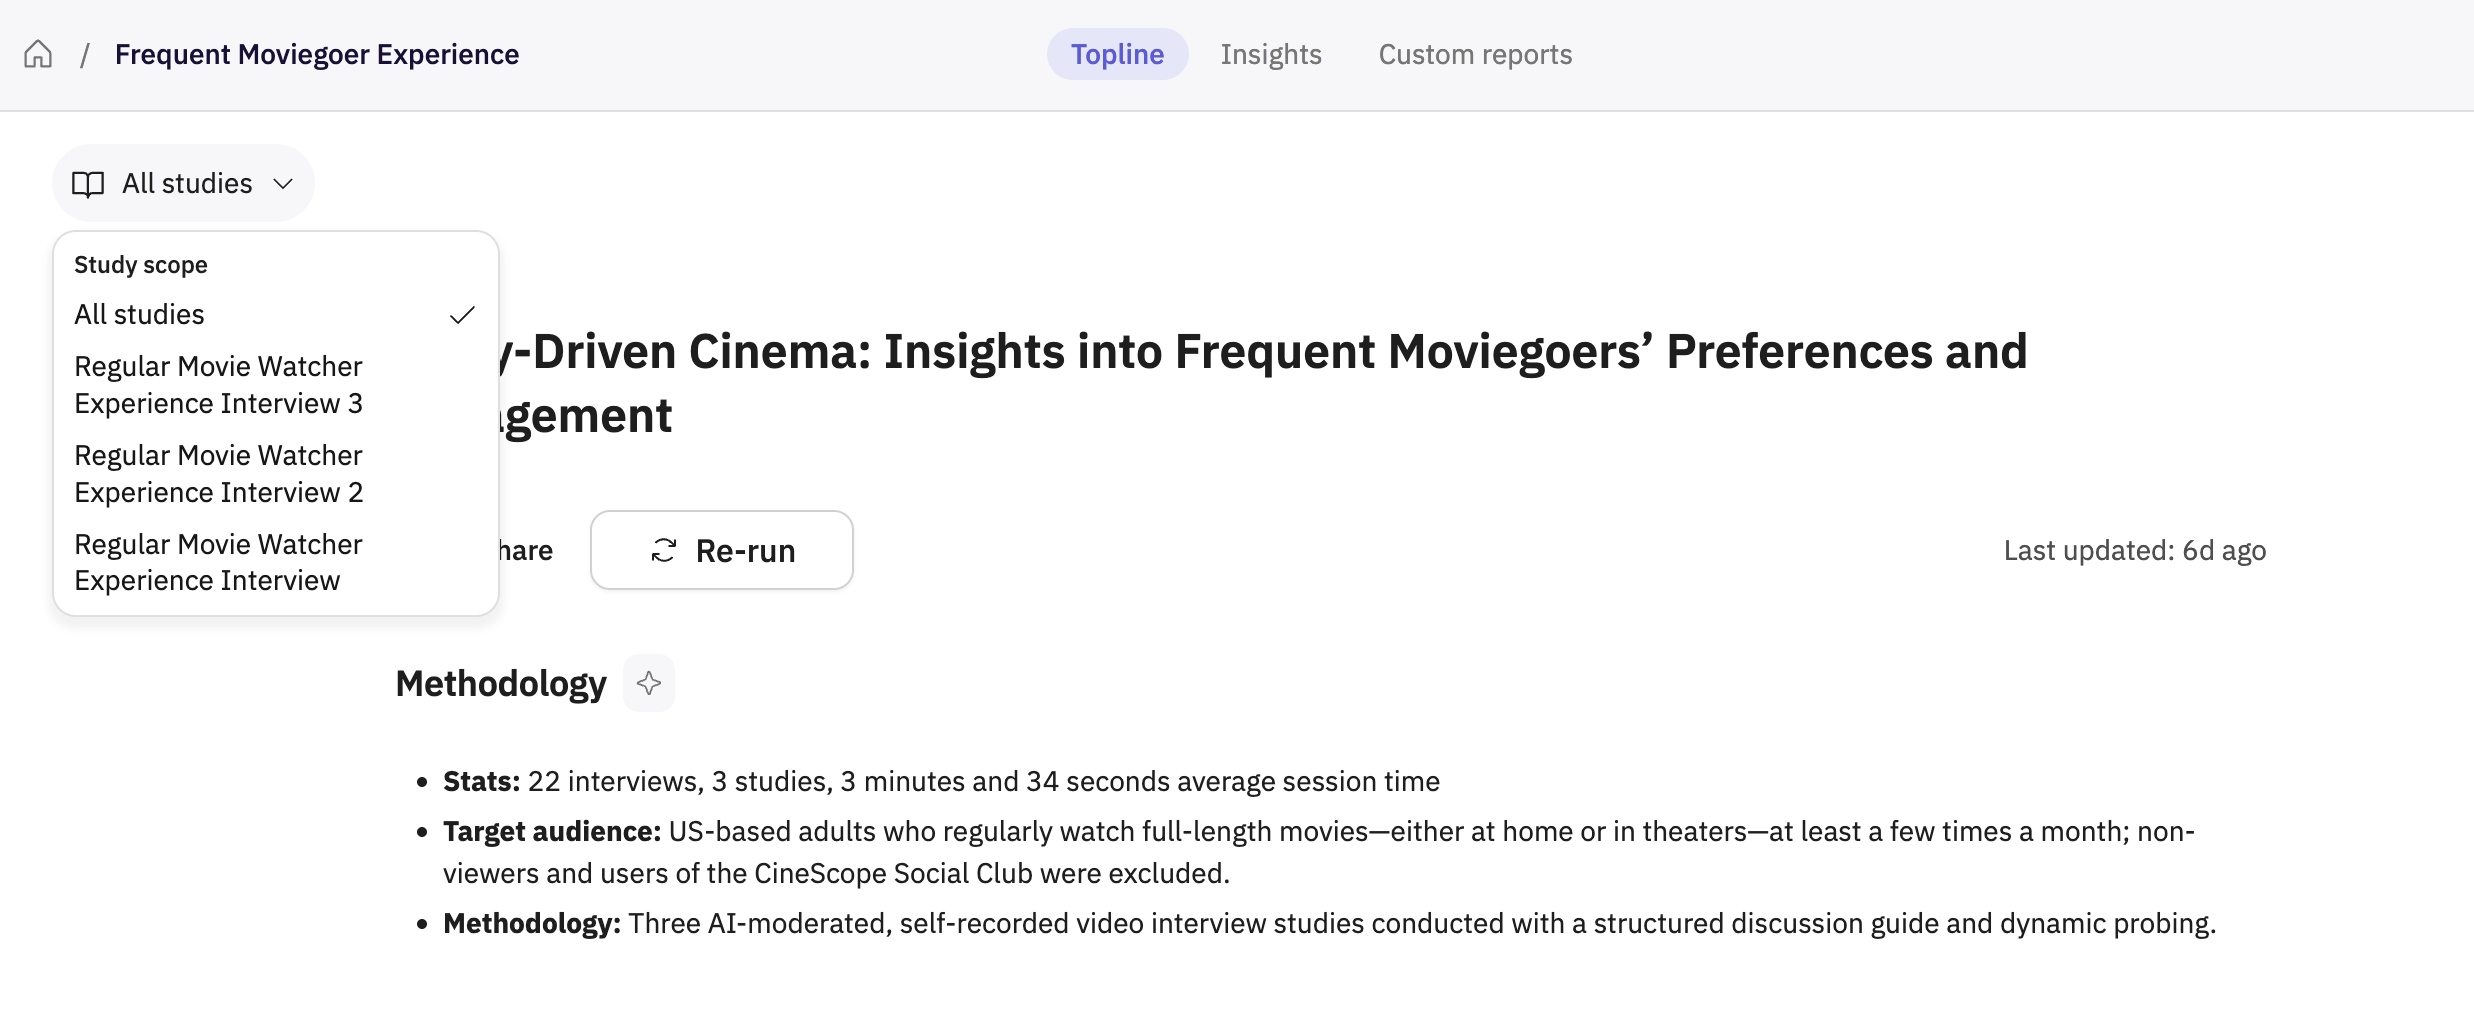
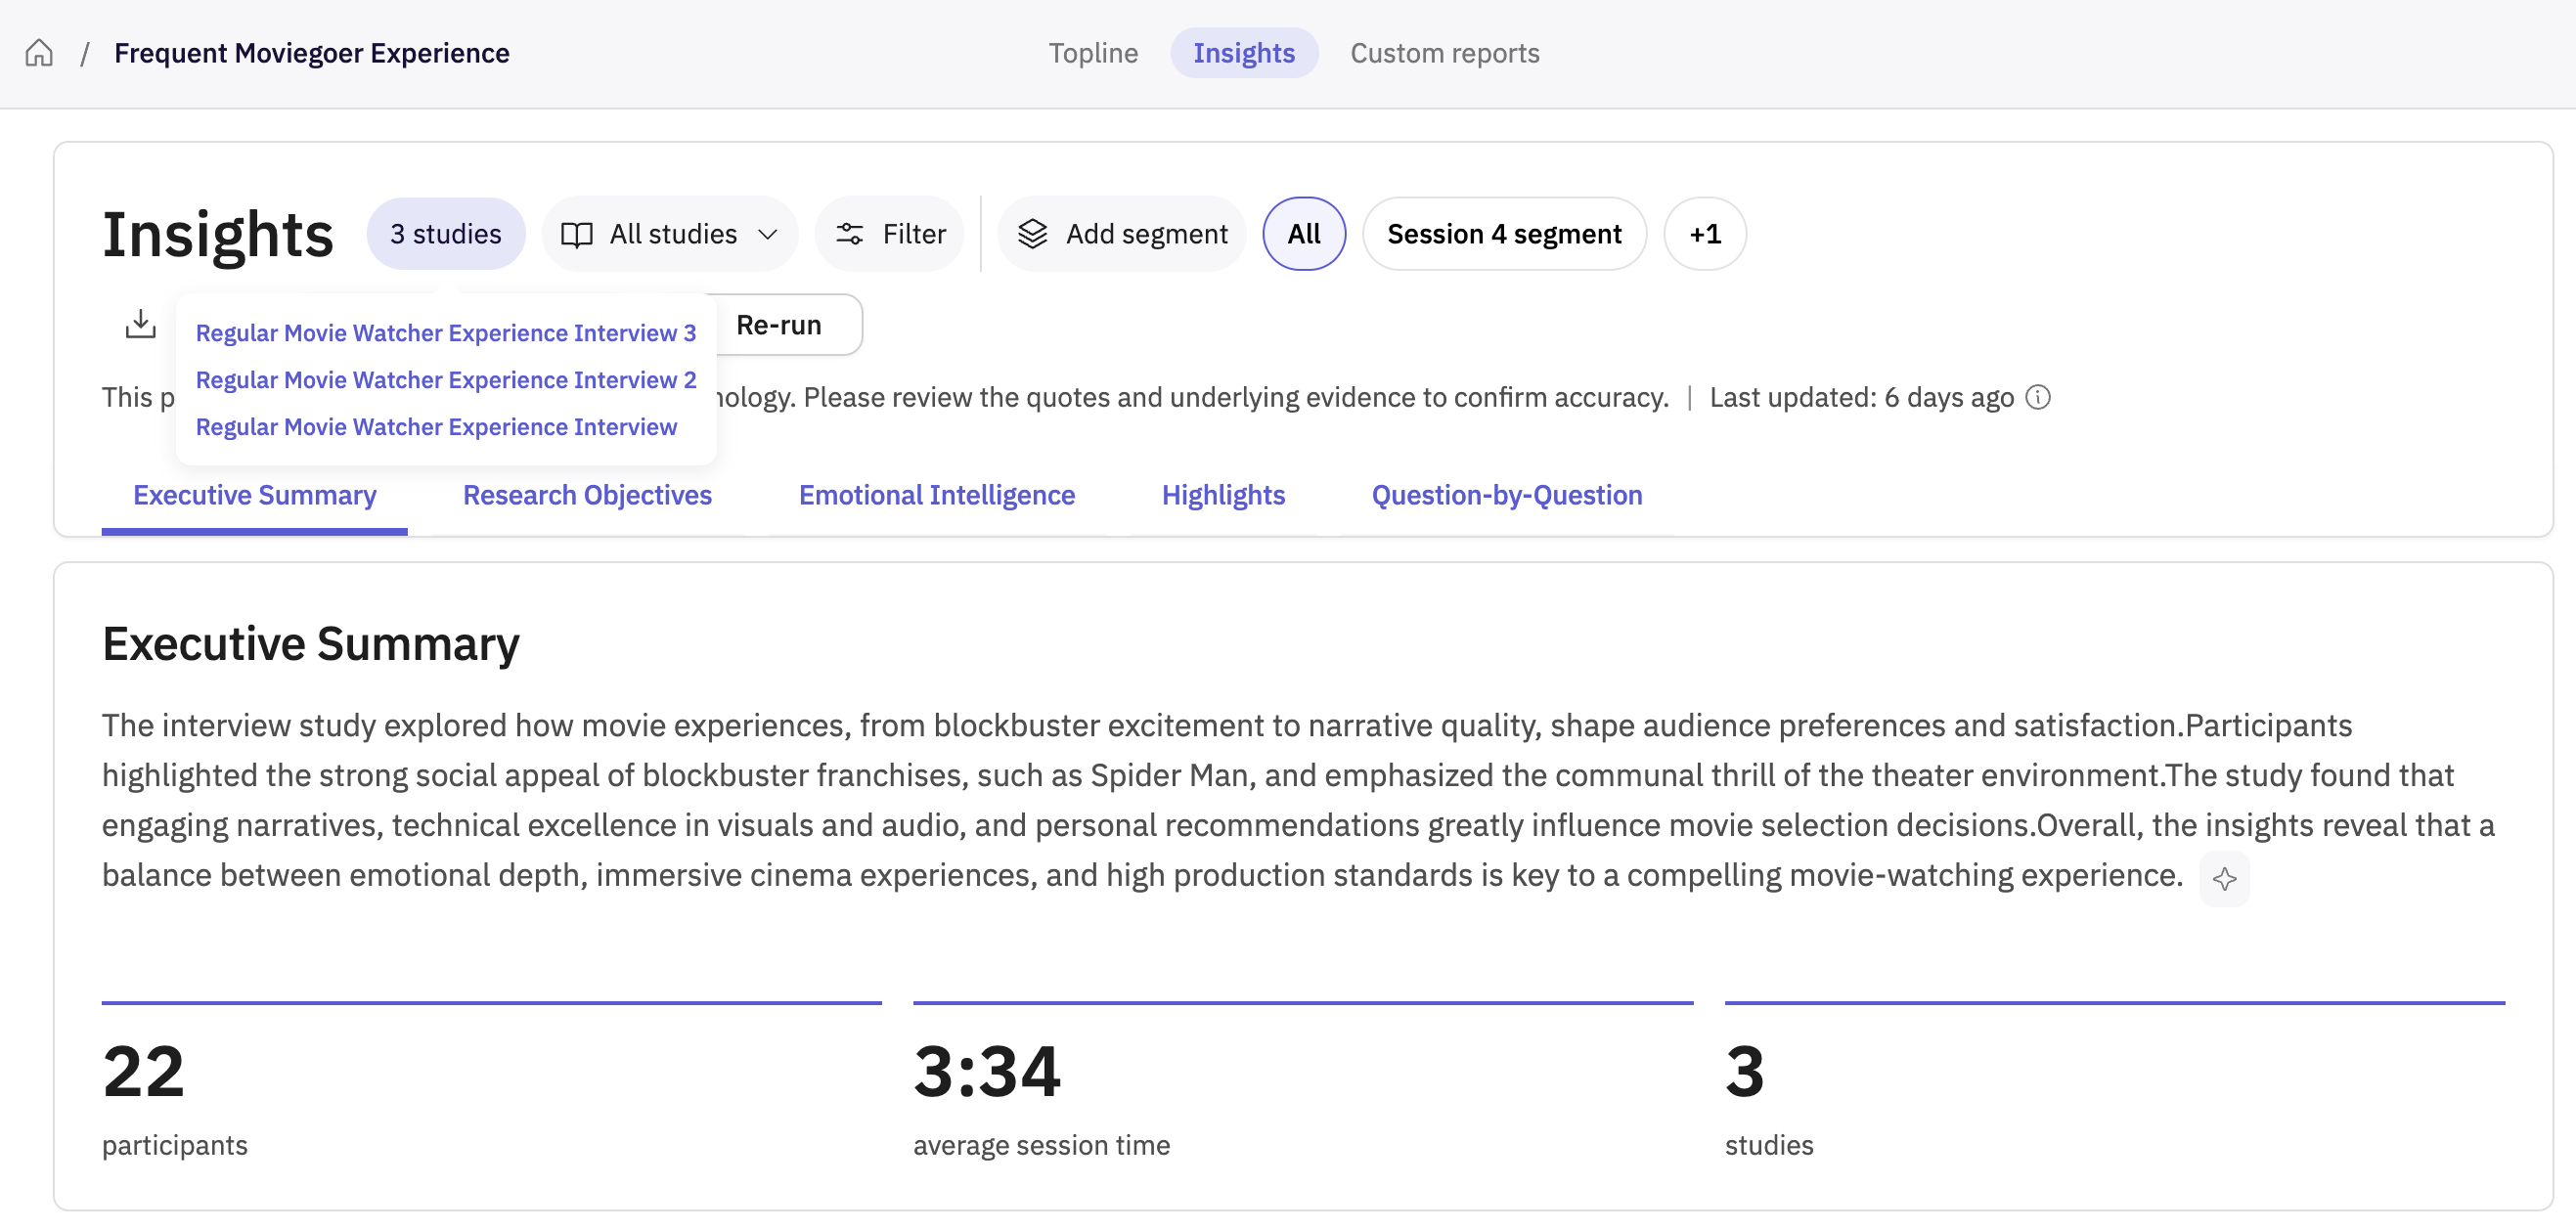
This is the right place to understand what happened in Session 2 on its own terms, separate from Session 1 or Session 3 — useful for catching something session-specific, like a spike in confusion right after a product change you rolled out between sessions.
Please note: if you click "Dive deeper" or open Chat With Your Data from within a session's Insights page, that conversation still pulls from the whole project — not just that session. You can filter the chat to target a specific session.
4. Compare sessions side-by-side with a Custom Report
To see how a specific question or theme evolved from one session to the next, go to the Reports tab, click + New Report, and when you're prompted to select a study, choose multiple sessions (studies) within your project instead of just one. This gives you one report that cross-examines the same question across sessions, rather than toggling between separate Insights pages and comparing manually.
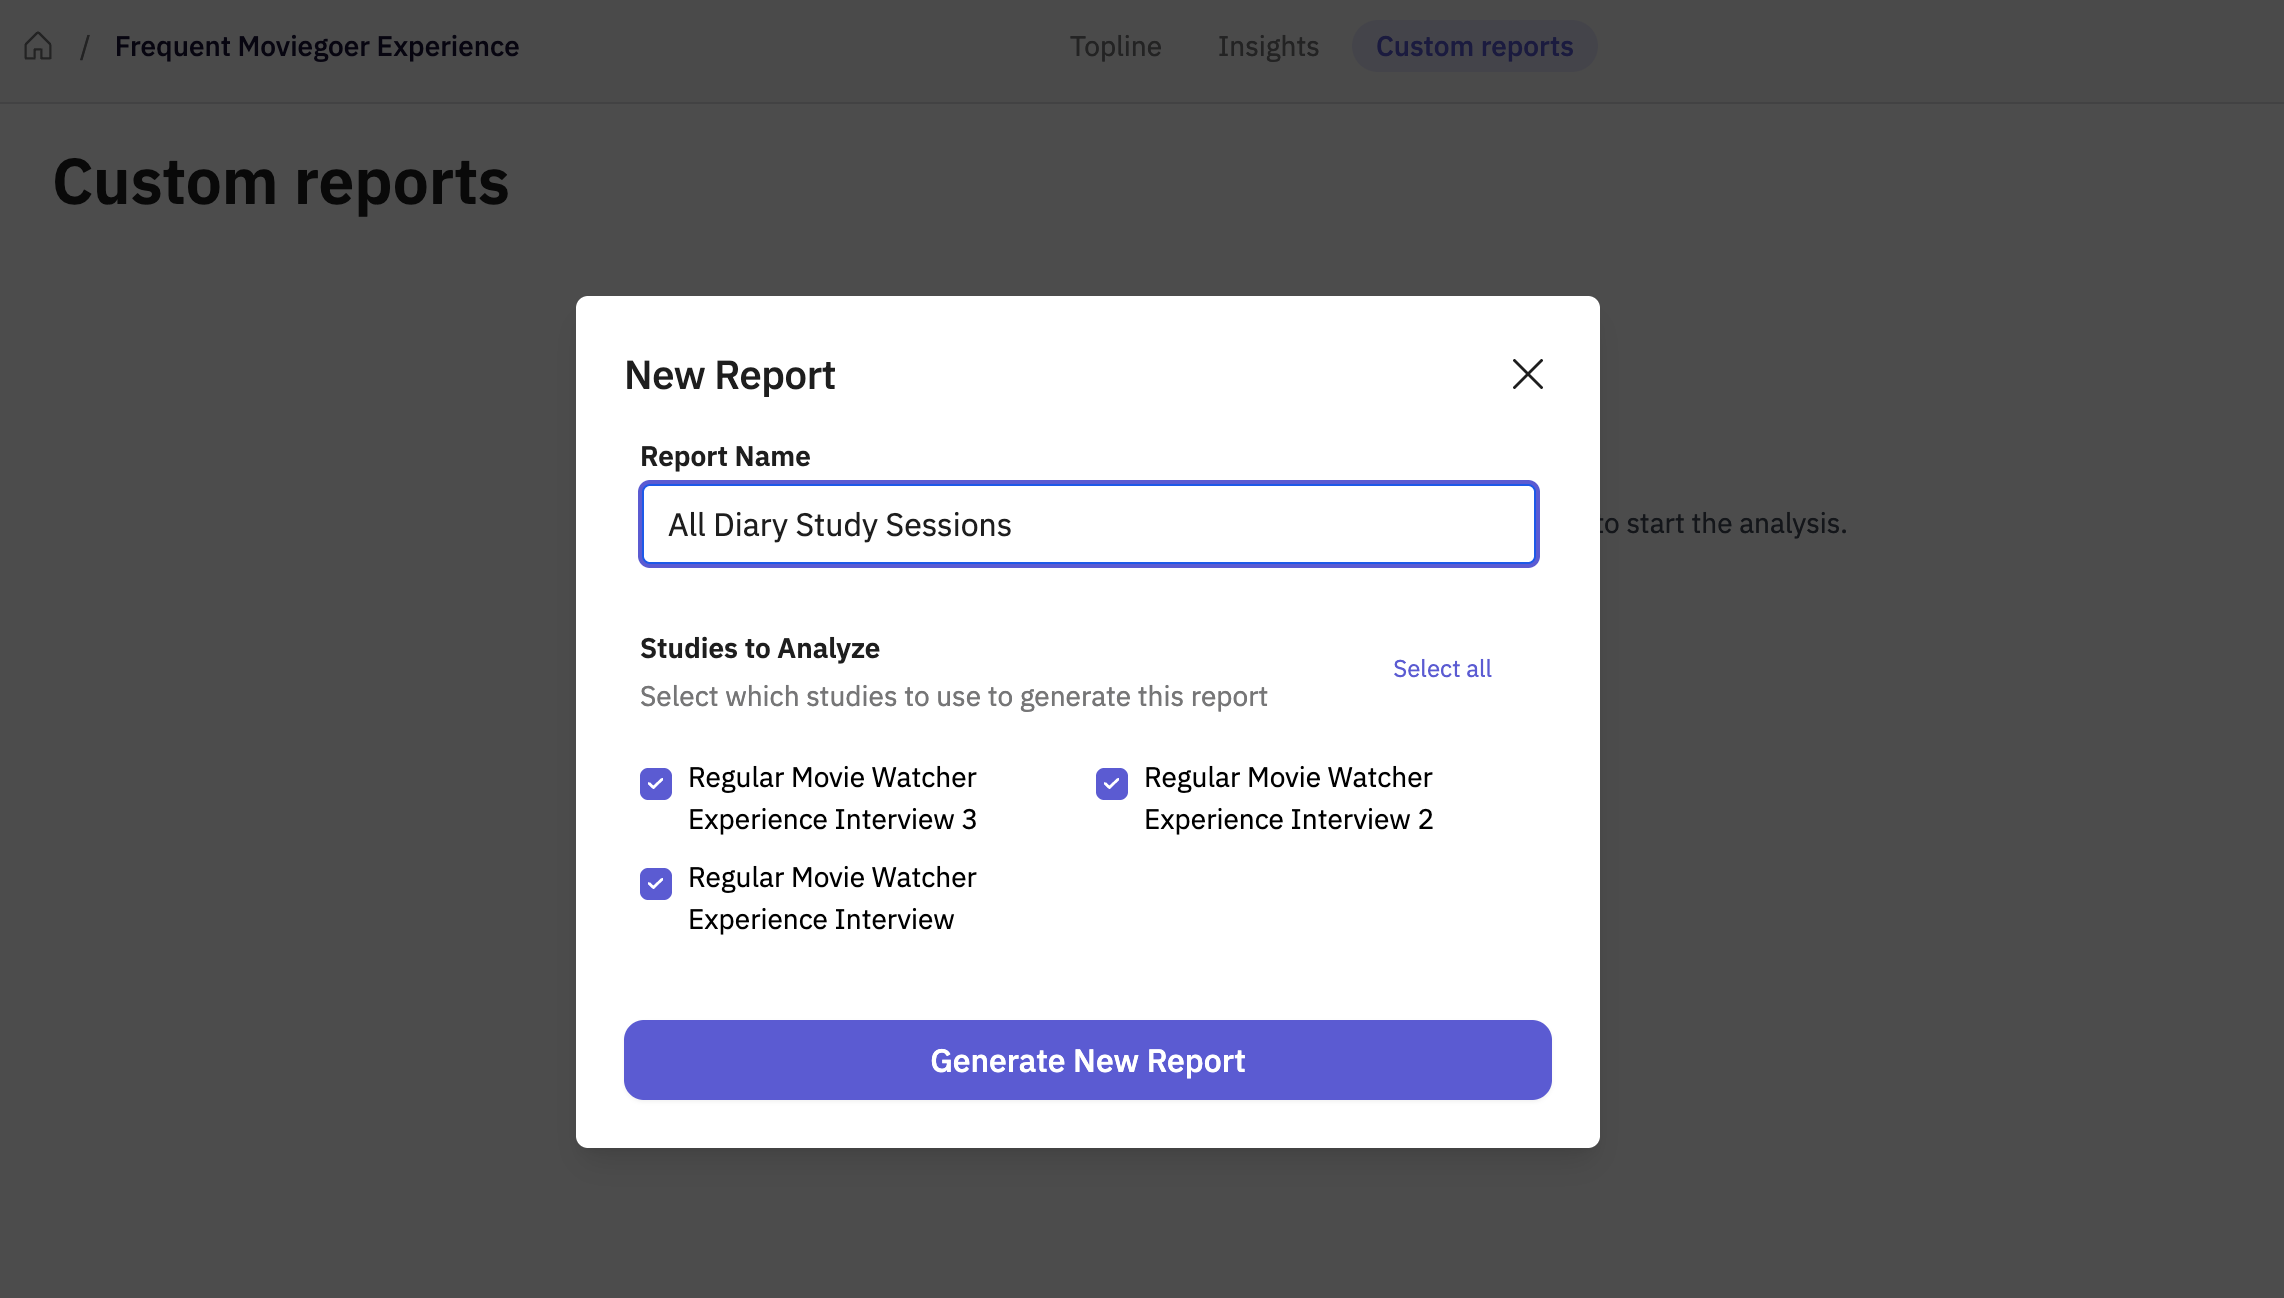
From there, you can build your comparison a couple of ways:
Question-by-question analysis: if you repeat the same guide question across sessions (a common diary study pattern also considered trends— e.g., asking "How satisfied are you with the product this week?" at every session), a cross-session report lets you see how the categorized responses to that same question shift from Session 1 to Session 4
Transcript-wide analysis: if you want to track a theme regardless of which question it came up under (e.g., mentions of a specific pain point), transcript-wide analysis pulls that across all selected sessions at once
Categorization type: use Themes to let AI surface what's changed organically, or set up pre-defined categories (e.g., satisfied/neutral/dissatisfied) if you want a consistent scale to track session-over-session
💡 Tip: This is currently the best way to build a true session-over-session comparison — for example, tracking how sentiment toward a product moved from the Week 1 session to the Week 4 session, using the same categorization applied consistently across both.
Cross-tab by session to see everything in one view
Once your report spans multiple sessions, add a crosstab with session as the subgroup. Instead of scrolling between separate categorized breakdowns per session, a crosstab lays out one question's responses side-by-side across every session in the report — so you can watch a single metric move over time in one table, rather than comparing across screens.
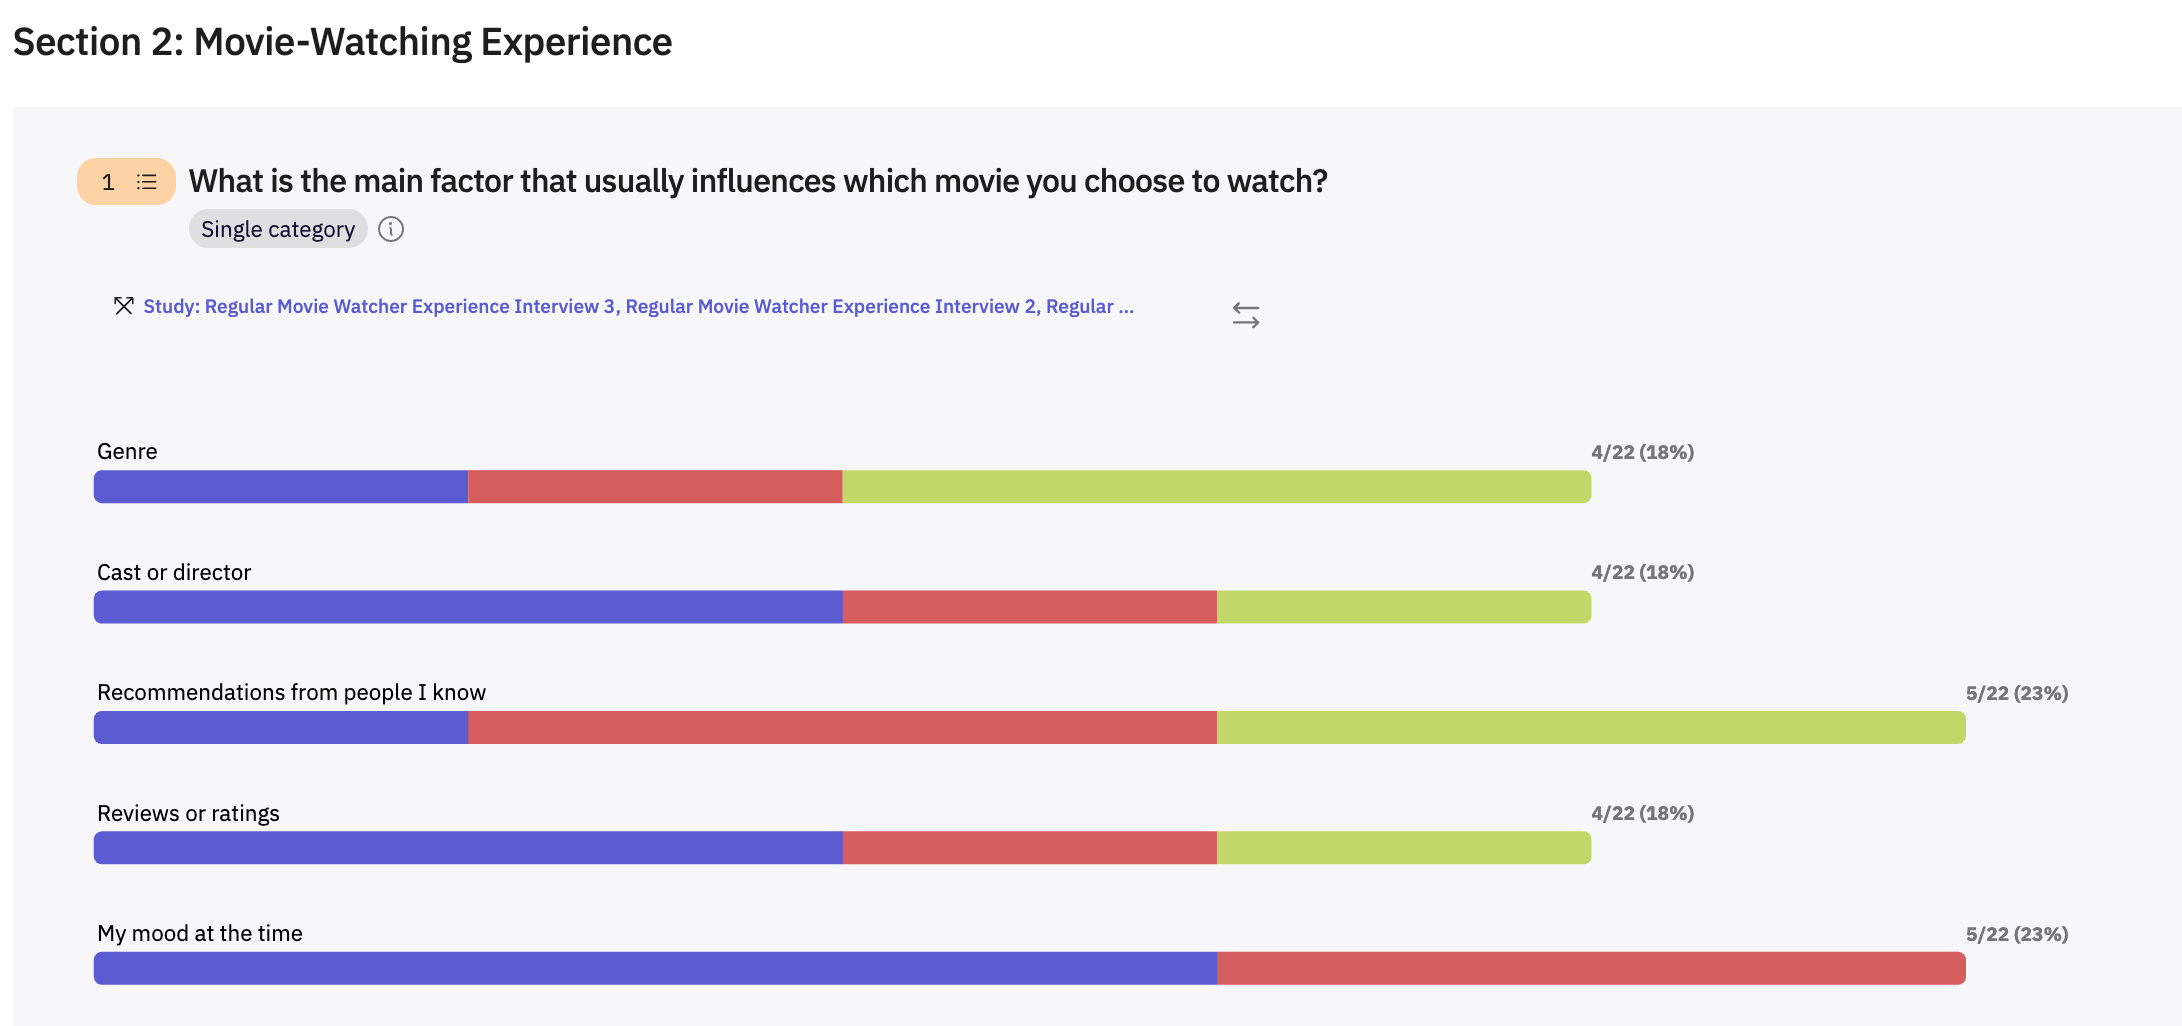
Please note: crosstabs (like filters and segments) only work on multiple choice questions — so this works best for tracking a repeated rating or multiple-choice question over time, rather than open-ended responses.
5. Go holistic with Chat With Your Data
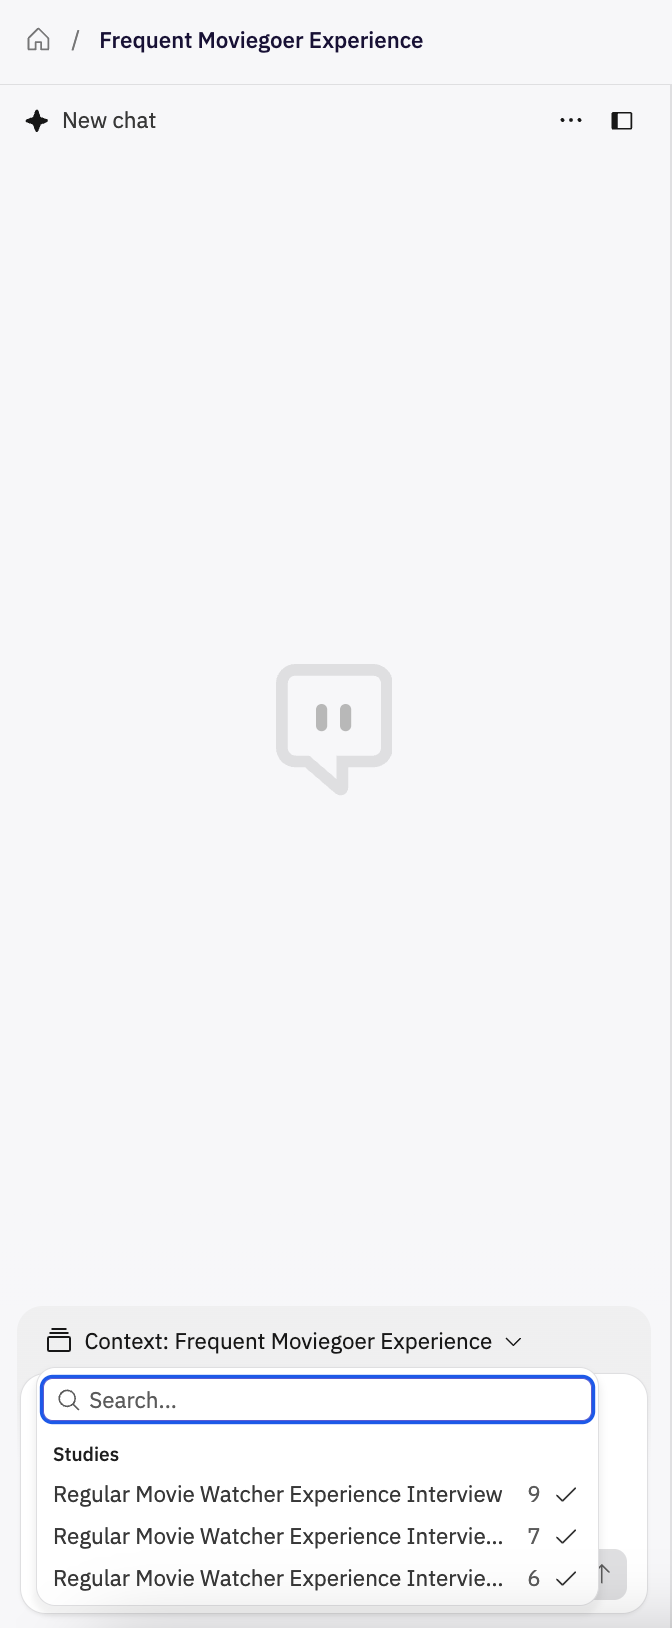
Chat With Your Data operates at the project level, so a conversation you start there automatically draws on all sessions in the diary study together. This is the best way to ask a big-picture question like "what changed in participants' routines over the course of this study?" without manually stitching sessions together.
Final tips
Each session in your diary study is its own study — check the right one before assuming you're looking at project-wide data
The participant table tracks status (Invited/In progress/Completed/Dropped), not content — pair it with Insights or Reports for the "what did they say" side
The recommended paths for cross-session comparison include:
Use each session's Insights page for session-specific detail
Use a Custom Report across sessions, with a crosstab by session, when you want a side-by-side comparison of a specific question or theme
Use Chat With Your Data for synthesized, cross-session questions
Filters, segments, and crosstabs only work on multiple choice questions
Hope this helps! If you have any further questions, please reach out to our team at support@outset.ai or via chat.